

Since India’s independence, the Census has enumerated Scheduled Castes (SCs) and Scheduled Tribes (STs) with their specific Jati (social group) details and their educational and economic profile. However, respondents were not asked if they belonged to Upper Castes or Otherwise Backward Classes (OBCs). The last comprehensive caste data comes from the 1931 Census, which estimated OBCs at 52% of the population. Current OBC reservation policies are still based on this outdated data.
Proponents of a national caste Census argue that updated information on all castes would improve affirmative action policies. Critics worry it could increase social tensions and expand quotas. Some even believe that caste has become irrelevant to understanding the inequalities in Indian society. Amid this ongoing debate, we argue that caste remains crucial in determining households’ livelihoods. Using data from the India Human Development Survey (IHDS) (I & II), National Sample Survey (NSS) (2011–2012) and Periodic Labour Force Survey (PLFS) (2022–2023), our analysis — focusing on broader caste categories, namely Others, OBC, SC, and ST — shows that caste continues to play a significant role in shaping economic transitions at the household level.
The IHDS for 2005 and 2011–2012 is the only available pan-India level panel dataset. It interviewed 41,554 households in 2005 and reinterviewed 85% in 2011. We aim to understand household-level transitions in the principal sources of income for each social group during a period of rapid economic growth in India, which likely created favorable conditions for shifts in livelihoods.
We categorize principal income sources into five groups: Agriculture Self-Employment (ASE), lower-tier, business, upper-tier and others. ASE includes cultivation and allied agricultural activities, which, according to the National Commission for Enterprises in the Unorganised Sector (NCEUS) (2007), are mostly part of the unorganized sector. Lower-tier income sources encompass earnings from wage labor in both the agricultural and non-agricultural sectors, as well as income from self-employment in the non-agricultural sector, such as working as an artisan, independent worker or in a petty shop or trade. All these activities are considered part of the unorganized sector, with workers facing varying degrees of vulnerability. Business refers to income earned from organized business or trade activities. Upper-tier income sources consist of earnings from regular salaried employment. The “others” category includes income sources such as pensions, rent, dividends and similar forms of income. These sources do not directly form part of the workforce and are therefore not considered here.
To understand the hierarchy between the different income groups, we compare the annual consumption expenditure per capita across households with different income sources as their principal income sources.
Investigating consumption expenditure
We find that in both periods, households with lower-tier income sources as their principal income sources have the lowest consumption expenditure per capita, followed by those engaged in Agriculture Self-Employment (ASE). In 2005, households with upper-tier income sources as their principal income source had the highest consumption expenditure per capita. In 2011, families with business income as their principal income source had the highest consumption expenditure per capita.
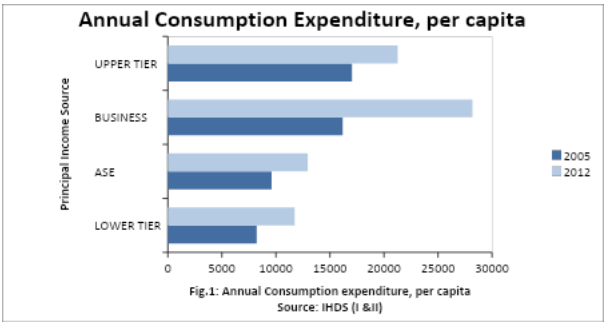
We cannot draw a definitive comparison among households with different principal income sources, as we are not considering the distribution of other assets, including land or durable goods. We may still argue that households relying on ASE and lower-tier income sources — largely concentrated in the unorganized sector — are likely to be more vulnerable compared to those relying on upper-tier income sources. We do not rank business income as more or less vulnerable compared to other sources because, while households with business income tend to have higher average consumption expenditure, business income is not a stable source of income as a significant percentage of households have transitioned away from business income to ASE or lower-tier (shown in the table below).
We now try to understand the household-level transitions.
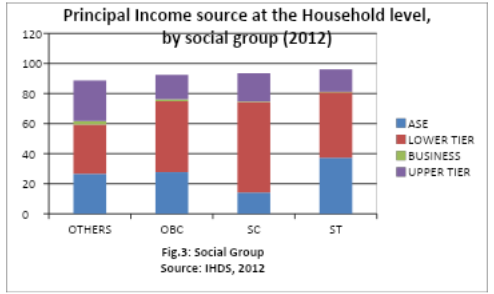
Principal income source at the household level, by social group
The proportion of households relying on ASE as their principal income source is highest for ST, followed by OBC, Others and SC in both periods. The proportion of households with lower-tier income sources as their principal income source is lowest for the Others group and highest for the SC group in both periods. In both 2005 and 2011, the proportion of households relying on business as their principal income source was significantly lower compared to any other income source across all social groups.
This clearly indicates that, at the household level, the principal income source is closely connected with social group dynamics as compared to other social groups, the Others group has the lowest proportion of households relying on lower-tier income sources and the highest proportion relying on upper-tier sources.

Percentage of households who have transitioned from one income source to another, by social group
We find that a significant percentage of households have transitioned from one income source to another between 2005 and 2012. For instance, among Others that relied on ASE in 2005, 32% have transitioned to other income sources, while among OBC households that relied on ASE in 2005, 35% do not have ASE as their principal income source in 2012.
Interestingly, the proportion of households transitioning out of business as their principal income source is quite high across all caste groups, ranging from 88% among the “Others” to 96% among SC households. This indicates the vulnerability associated with relying on business income as a primary source.
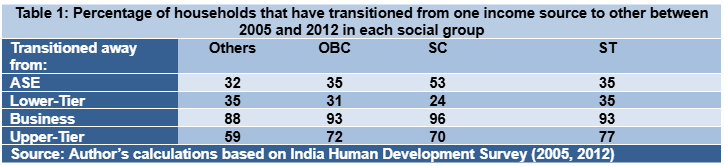
Lastly, the proportion of households transitioning out of upper-tier income sources is highest among the ST group (77%), followed by OBC (72%), SC (70%) and the “Others” group (59%).Note: The Others column sum doesn’t add up to 100. The way to read any entry is this: among Others households that earned their principal income from ASE in 2005, 32% shifted to some other income source in 2012, and 68% continued to rely on ASE as the principal income source in 2012 as well.
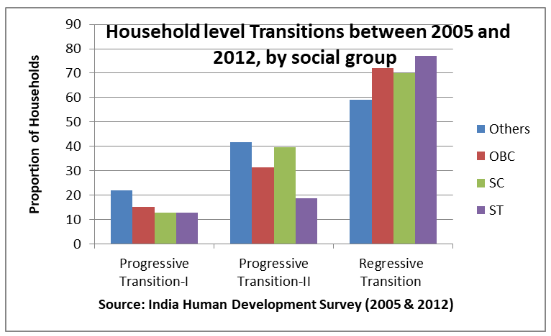
Nature of transitions: progressive or regressive
We consider two types of transitions in our analysis: progressive transitions and regressive transitions. We consider two categories of progressive transitions-I & II. Progressive transition-I is one when a household shifts from ASE to upper-tier income sources as their principal source of income between 2005 and 2012. Progressive transition-II is when a household shifts from lower-tier income sources to upper-tier income sources between 2005 and 2012. Conversely, a regressive transition refers to households moving from upper-tier income sources to ASE or lower-tier income sources.
Note that the percentages reported below represent the distribution of households that have made transitions, focusing specifically on those who have transitioned away from their original income sources.
Among SC households that have transitioned from ASE, 12.6% have progressively transitioned to upper-tier income sources compared to 15% for OBC households and 12.8% for ST. The highest proportion is found in the “Others” group at 22%.
Among SC households that have transitioned from lower-tier income sources, 40% have progressively shifted to upper-tier income sources. In the “Others” group, the proportion is higher at 42%. Among OBC households that have shifted away from lower-tier income sources, 31% have progressively transitioned to upper-tier income sources, while 18.5% of ST households that transitioned out of lower-tier sources have moved to upper-tier income sources.
In terms of regressive transitions, 60% of households in the “Others” group that have transitioned out of upper-tier income sources have shifted to lower-tier or ASE income sources in 2012. The highest proportion of regressive transitions is observed among ST households at 77%, followed by 72% for OBC households and 70% for SC households.
Clearly, the transitions seem to reproduce the existing hierarchies with the proportion of Others who are able to make progressive transitions being higher than other social groups though the proportion of SCs who are able to make progressive transition-II is approximately similar to Others.

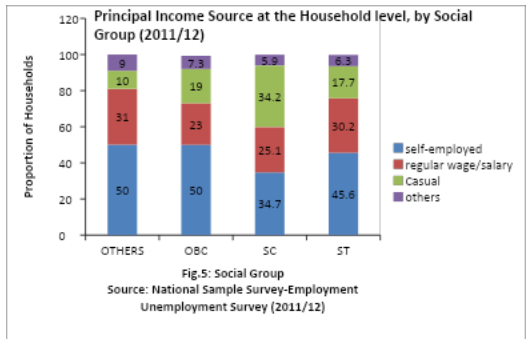
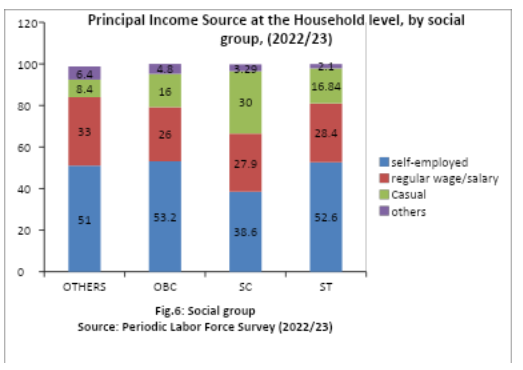
Next, we utilize the NSS-employment unemployment survey (NSS-EUS 2011–2012) and Periodic Labor Force Survey (2022–2023) to compare the percentage of households by their principal income sources within each social group in 2011–2012 and 2022–2023.
We do not establish a hierarchy among income sources in this analysis, as we focus on four broad categories: self-employment, regular wage/salary, casual labor and others. However, caste-related patterns in livelihood generation are evident, with SCs having a higher reliance on casual labor compared to other social groups in both time periods.
Interestingly, the percentage of Others who rely on regular wage/salary is the same as the percentage of ST households who rely on regular wage/salary (around 30%) in 2011–2012. By 2022–2023, the percentage of households who rely on regular wage/salary has increased slightly across all social groups, except for a slight decrease among the ST households.
The proportion of households that rely on self-employment is the same across Others and OBCs in 2011–2012 while being the lowest among SCs. By 2022–2023, the proportion of households that rely on self-employment is similar across all social groups (51-52%) while being the lowest for SCs at 38.6%.
Our analysis clearly reveals that caste continues to play an important role in shaping and determining livelihood strategies at the household level. Between 2005 and 2012, the relatively high growth phase in the Indian economy, the transitions have been such that the hierarchies have been reproduced, with the percentage of households making regressive transitions being higher across all social groups compared to Others.
While we cannot observe transitions for the same set of households with the NSS-EUS and PLFS data, as it is not a panel data set, the overall patterns reveal the following:
Our analysis shows that caste remains a key factor in shaping household-level economic transitions. The IHDS dataset, which tracks the same households between 2005 and 2012, suggests that these transitions often mirror existing hierarchies, with the lowest proportion of regressive transitions found among the “Others” group. Additionally, the NSS data for 2011 and 2022 underscores the clear division in income sources across broader caste categories.
[Lee Thompson-Kolar edited this piece.]
The views expressed in this article are the author’s own and do not necessarily reflect Fair Observer’s editorial policy.
What’s Wrong With India’s Goods and Services Tax?
Seven years after implementation, India's Goods and Services Tax (GST) system still suffers from flaws like inconsistent rates, inefficiencies, and...

The Enduring Relevance of Development Economics in an Unequal World
Some economists argue that as developing countries’ incomes rise and mainstream economics converge with development studies, the distinctiveness of development...

Requiem for an Empire: How America’s Strongman Will Hasten the Decline of US Global Power
In 2010, I predicted that US international power would decline by 2025 thanks to a right-wing president. With President-elect Donald...

Support Fair Observer
We rely on your support for our independence, diversity and quality.
For more than 10 years, Fair Observer has been free, fair and independent. No billionaire owns us, no advertisers control us. We are a reader-supported nonprofit. Unlike many other publications, we keep our content free for readers regardless of where they live or whether they can afford to pay. We have no paywalls and no ads.
In the post-truth era of fake news, echo chambers and filter bubbles, we publish a plurality of perspectives from around the world. Anyone can publish with us, but everyone goes through a rigorous editorial process. So, you get fact-checked, well-reasoned content instead of noise.
We publish 2,500+ voices from 90+ countries. We also conduct education and training programs
on subjects ranging from digital media and journalism to writing and critical thinking. This
doesn’t come cheap. Servers, editors, trainers and web developers cost
money.
Please consider supporting us on a regular basis as a recurring donor or a
sustaining member.
Will you support FO’s journalism?
We rely on your support for our independence, diversity and quality.
Comment